
Turning Expansion Engines into Metrics
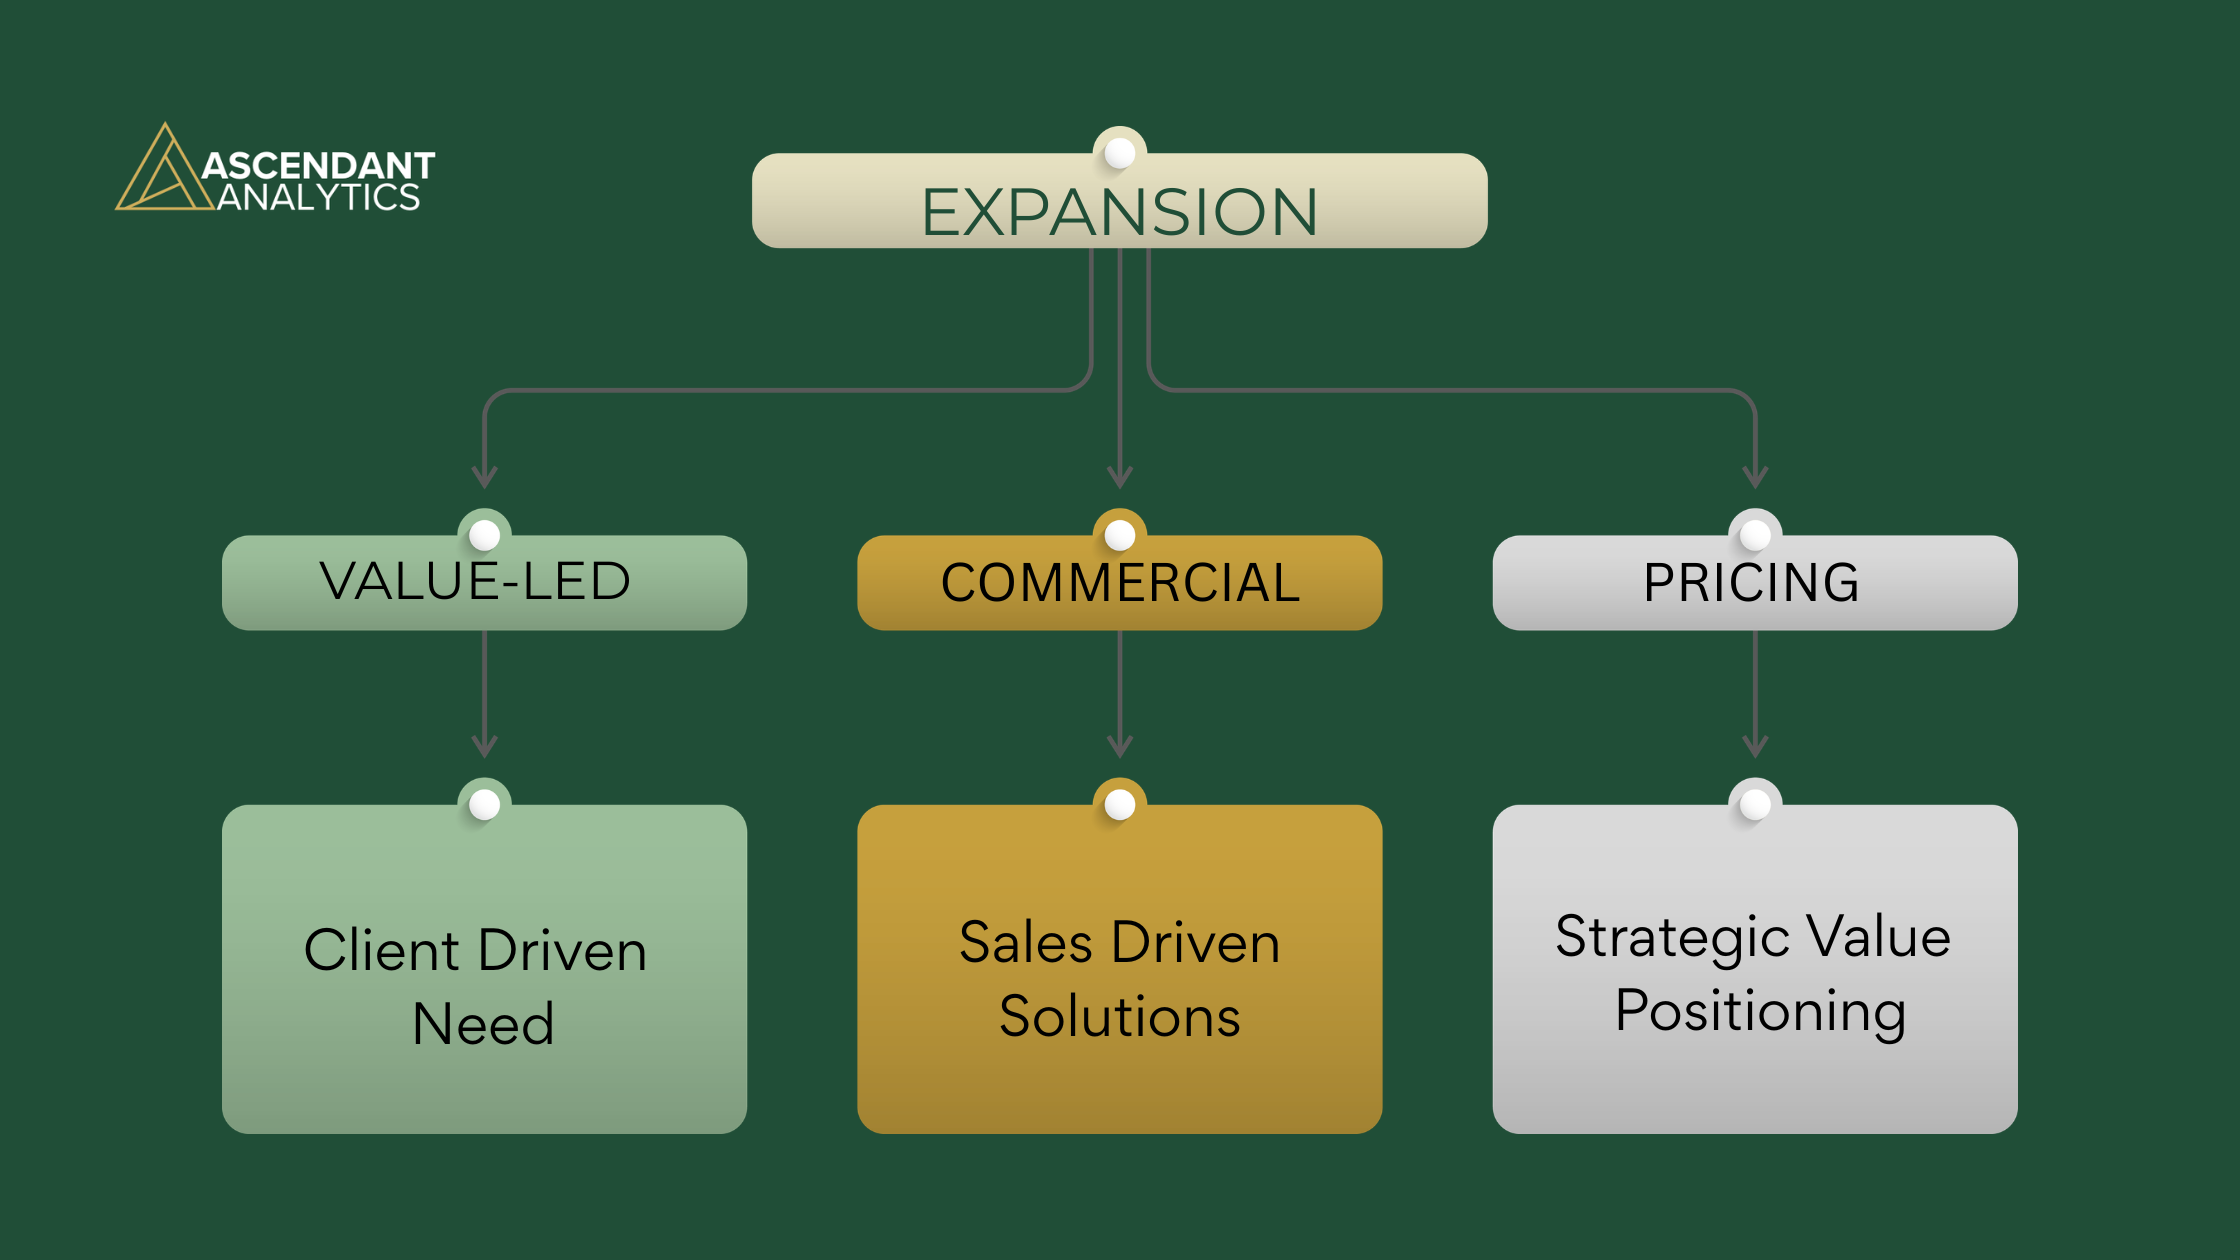
In this series so far we learnt that expansion really has three engines: value, commercial, and pricing. Each owned by different teams, each telling a different story about the health of the business. Most companies treat expansion as a single number in the board pack, but with a change in perspective we can understand expansion more clearly.
Conceptually the model makes sense, how is it measured though? Translating it into metrics is the hard part.
Only two engines show up directly as ARR. The third, value, is the engine that creates future expansion but doesn’t always create revenue in the same period. This is what makes the attribution conversation so important and why the traditional NRR formula can mislead boards into thinking the engine room is stronger than it really is.
Lets dive into a practical, executive-friendly way to turn the three engines into a measurable model.
Finance and pricing teams uplift contract value through structured programmes.
Each engine deserves its own metrics because each requires different interventions.
How to Measure the Three Engines
A practical model any enterprise subscription business can use
Most metrics fall into one of two categories:
Direct ARR metrics (hard financials)
Commercial and pricing expansion are in this category
Leading indicators (signals that expansion is likely to occur)
Value-led expansion usually goes here.
The goal isn’t precision. The goal is clarity.
Commercial Expansion
The easiest engine to measure
Executives should measure it as Commercial Expansion ARR
Revenue added to existing accounts through:
cross sell, upsell, broader access, or transformation of contract structure.
This applies across every subscription business model:
SaaS: new modules, add-ons, enterprise plans, increased seats
Research & data: new domains, datasets, regions, business units
Workflow & analytics: more teams onboarded, advanced capabilities
Managed or hybrid models: expanded scope, advisory layers, additional services
The key is cohort purity. This helps leaders see where commercial teams genuinely influence growth.
Count expansion only for customers that existed at the start of the period. Otherwise the metric gets inflated by new logos that expand quickly.
Segmentation makes this engine far more insightful:
By segment (enterprise, mid-market, long-tail)
By region
By product line
By account manager
By deal type
Pricing Expansion
Also measurable directly in ARR
Much easier to quantify than many businesses realise.
It is simply Pricing Expansion ARR
The uplift generated from structured pricing actions applied to existing customers.
Examples include:
Annual price increases
Inflationary uplifts
Harmonising legacy customers
Reducing discount liabilities
Monetising newly introduced capabilities
Correcting underpriced accounts
This engine often has the biggest influence on long-term economics.
It deserves measurement in its own right.
When pricing expansion is monitored separately, executives can see:
whether pricing power is real or forced
whether discounts are drifting higher
whether NRR is being carried by price rather than value or commercial performance
Value-Led Expansion Metrics
The engine that creates future ARR: measured through behaviour
Value-led expansion creates demand before it creates revenue.
This is the engine that tells you whether the product has true gravitational pull or whether commercial teams are “propping up” NRR through effort alone.
The challenge is that value-led expansion is not always visible in ARR.
That is why it needs its own metrics that are lightweight, directional, and interpretable.
Different business models require different indicators.
I believe the best approach is to break value-led indicators into three measurable pillars:
-
What users do inside your platform
This applies to all digital subscription businesses:
research platforms
data portals
analytics tools
workflow systems
hybrid products with digital components
Examples:
number of active users
breadth of topics or datasets accessed
dashboards or reports viewed
API calls
search or query volume
session frequency and depth
repeat engagement on high-value content
These metrics reveal breadth and depth of engagement, which are strong predictors of future expansion.
-
Where your product sits in the customer’s workflow
These are the strongest signals of all because they show organisational dependence.
Examples:
API integrations into internal BI platforms
data used in planning, forecasting, or risk models
dashboards embedded inside internal tools
scheduled programmatic queries
connections to CRM or operational systems
When a product becomes part of a workflow, expansion is highly predictable.
-
How customers interact with your team
This is the part businesses often undervalue.
For many enterprise subscriptions, the relationship with experts, analysts, or support teams is core to the product.
Examples:
attendance at analyst briefings
strategic planning calls
depth of questions asked
frequency of training sessions
number of team members involved in reviews
engagement with customer success
These are all strong, observable indicators of growing value.
You don’t need to survey customers.
You just need to monitor your own interactions.
How to Turn Leading Indicators Into a Value-Led ARR Metric
Once the pillars are defined, the most effective way to quantify value-led expansion is simple:
Tag every expansion deal with its primary driver.
Was the expansion:
value-led? (demand grew organically through usage or engagement)
commercial-led? (captured through proactive selling)
pricing-led? (uplifts, harmonisation, repricing)
This lets you create a lagging metric:
Value-Led ARR Contribution
The portion of expansion ARR attributable to accounts with clear value-led indicators in the period prior to renewal.
This does not require statistical models, but it does require categorisation discipline.
It is the clearest view most leadership teams will ever get of whether expansion is being earned or engineered.
When companies separate the engines (and measure them appropriately!)
Executives gain clarity, now they can see which engine is carrying growth and which is underperforming.
Commercial teams gain alignment. So they stop confusing value demand with deal mechanics.
Product and research teams gain legitimacy, and can demonstrate their influence on future expansion.
NRR stops being a flattering mirror. It becomes a diagnostic tool, meaning executives finally see the underlying patterns shaping long-term sustainability.