
The Magic of Tabular Editor
Welcome to the third article of our AI Ready Semantic Model Series, check out Articles One and Two for more on this topic.
It’s not often you get to feel like a wizard when you’re working with data, but with Tabular Editor in my Power BI work I get to live out my LOTR dreams. Except instead of a magic staff, I’ve got C#, and instead of spells, I’ve got scripts that save me from clicking through 47 different objects in the model manually. Magic, with curly brackets.
Tabular Editor works it’s magic like a friend who shows up with a label maker and alphabetises your spice drawer while you’re still thinking about getting off the couch. It doesn’t just let you tweak the model more efficiently, it actively improves your working life. Once you get the hang of it, going back to doing everything in Power BI Desktop feels like trying to type with oven mitts on.
One of the first things I came to love about Tabular Editor was the Best Practice Analyzer. It checks your model against a set of recommended rules; things like naming conventions, hiding unused columns, making sure you don’t have 38 different variations of the word "Amount" exposed to users. It’s a great way to keep things clean without relying on memory or good intentions. Better still, many of these issues can be auto-fixed with a click. You can clean up dozens of fields in one flick of your wand.
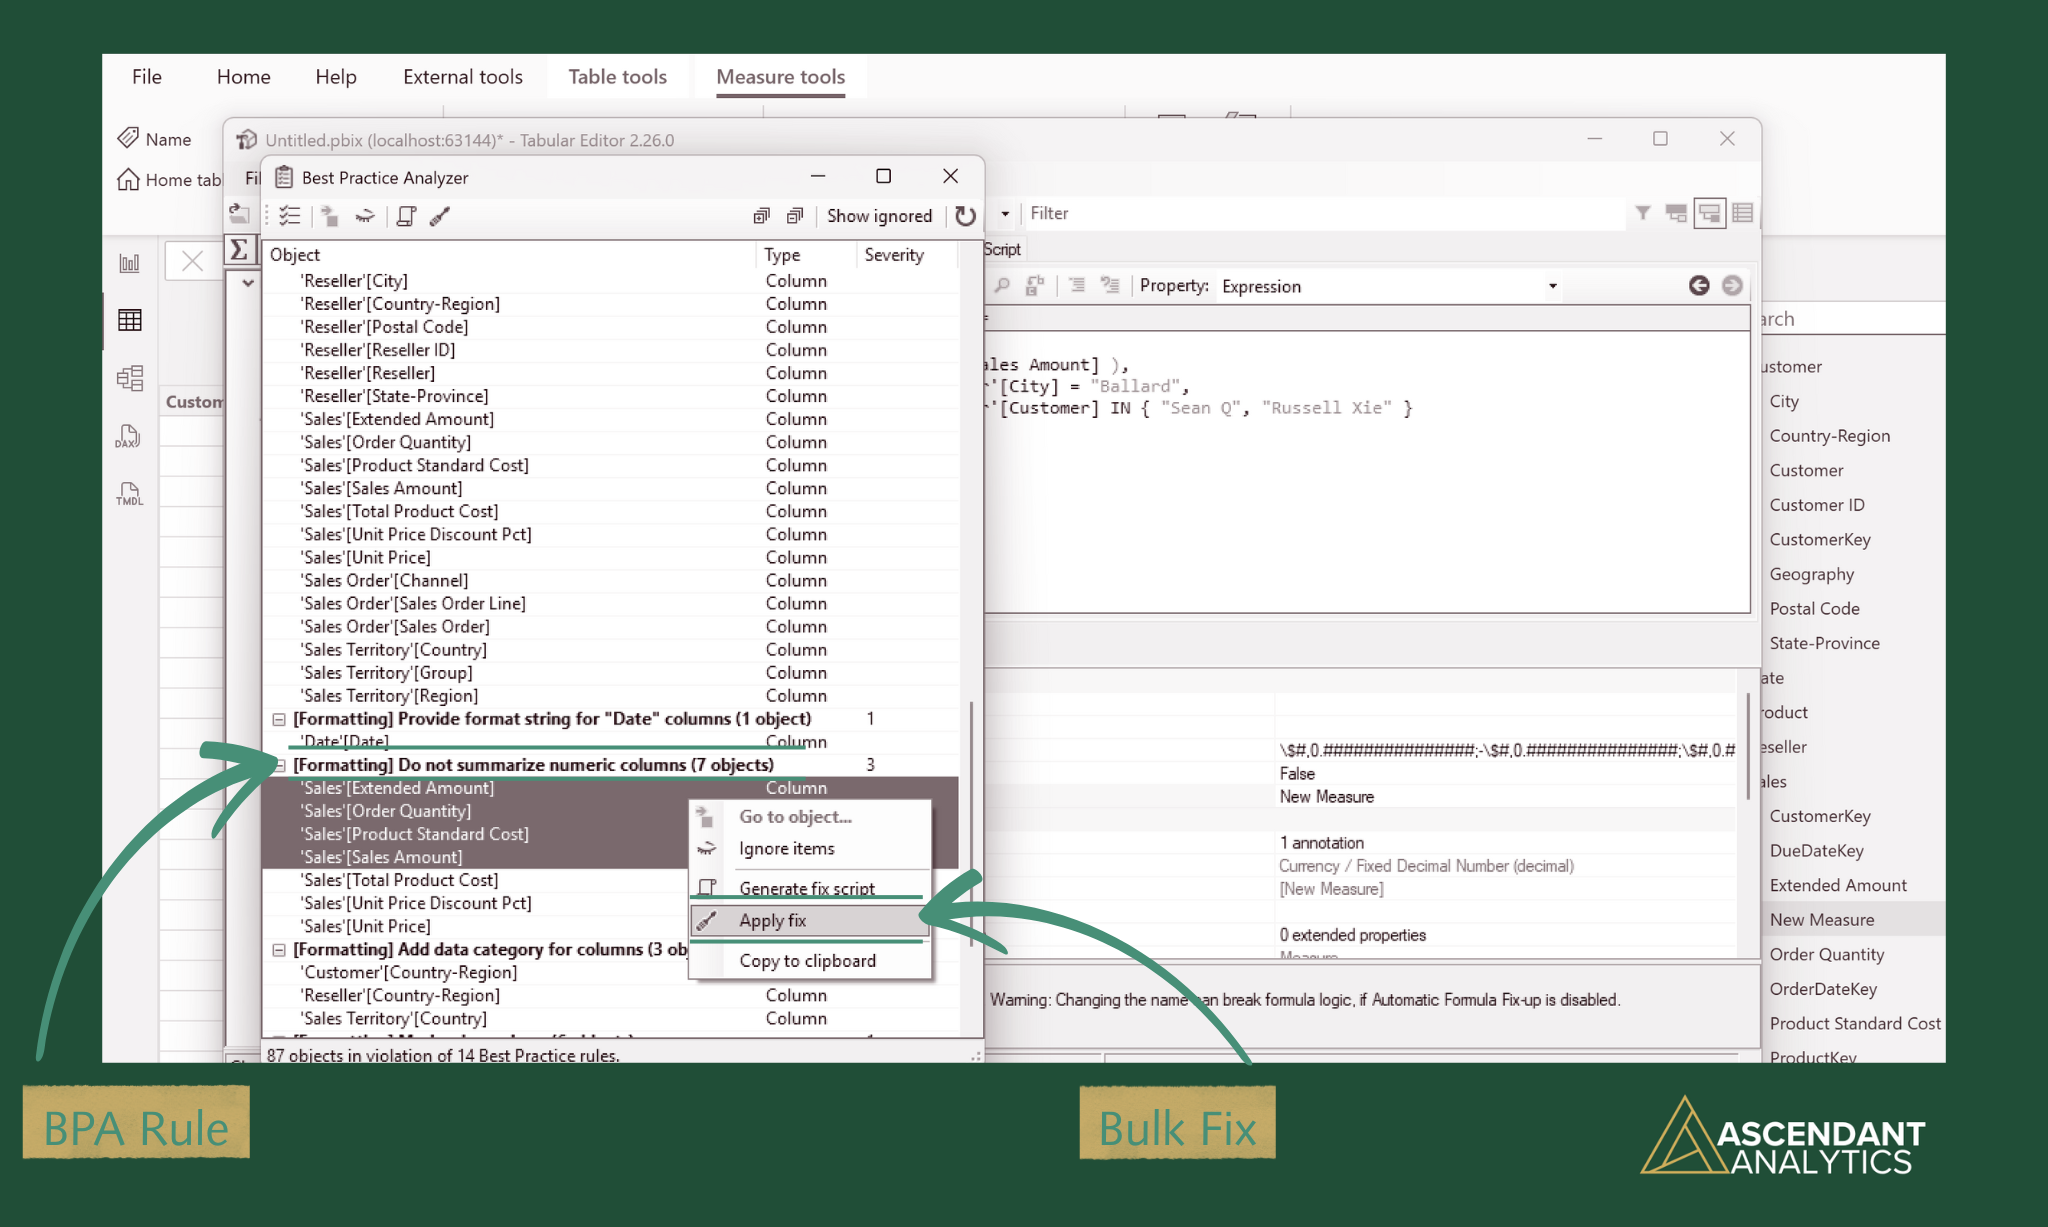
Image thoughtfully produced with Canva© for Ascendant Analytics
In Power BI Desktop saving a single measure can trigger a model recalculation giving your CPU a small existential crisis, but Tabular Editor lets you make all your changes first, then save them in one go. This alone has saved me hours of watching spinning wheels.

Produced on Canva© for Ascendant Analytics
The ability to make bulk changes is where Tabular Editor truly shines. One of my all-time favourite examples was a project where I’d written around 30 different DAX measures, all using the same filter inside CALCULATE. During testing, I realised the logic needed to include an additional value. Rewriting 30 measures manually would have taken ages, so instead I used this tiny C# script:
Job done in under a minute. And just like that, a script saved my weekend!
It’s not just about speed, either. Tabular Editor helps make your model more usable. You can organise your measures and columns into display folders, apply consistent formatting, and bulk-update descriptions so everything looks tidy and intentional. This kind of polish goes a long way, whether you’re helping a human navigate the model or giving Copilot the structure it needs to interpret your data properly.
That metadata becomes even more useful when you’re trying to build a data dictionary. I used to extract all of that out of Tabular Editor to create external documentation for users. It was a bit fiddly but I found it incredibly valuable. Now, thanks to recent updates in Power BI itself, you can actually surface metadata like table, column, and measure descriptions directly inside the model, build a simple dictionary table using new DAX functions, and serve it up to users in a searchable format.
This change has been a game-changer. Users can quickly check what a measure does, what a column represents, or how a date table is structured, all without leaving Power BI. It helps people explore more confidently, ask smarter questions, and write better prompts for Copilot. Because the fewer misunderstandings they have, the fewer contradictory charts you get on a Monday morning.
The real magic of Tabular Editor lies in its ability to automate the boring stuff and enforce good structure without slowing you down. Stuff like enforcing naming rules, hiding clutter, or scripting a bulk update. It helps you build like someone who’s thought things through, making the model easier to navigate and maintain. All that makes it much easier for Copilot to make sense of too, which is a bonus.
Speaking of automation, the latest release of Tabular Editor has added a standalone Best Practice Analyzer that can run outside the UI. You can now audit your model's compliance with best practices entirely from the command line, making it easy to integrate with version control or CI/CD pipelines. It's a great way to enforce modelling standards without even opening the app.
For the ‘white wizards’ among us who are keen to really delve deep, Microsoft has recently introduced a new TMDL (Tabular Model Definition Language) view in Power BI Desktop. It lets you view and edit your semantic model in plain text, a bit like opening the wiring diagram of your report. Especially useful for source control and fine-tuning, but probably not where most users will want to spend their afternoons. Tabular Editor still wins for usability and bulk editing, and it’s exciting to see the more advanced features gradually becoming native.
Even if you’re just starting out, it’s worth installing Tabular Editor and experimenting. A few small changes can make a big impact on performance and usability. You’ll spend less time fighting your model and more time doing the work that matters. And you might even feel like a wizard doing it.
Next up: Q&A optimisation through metadata, synonyms, and naming that doesn’t give Copilot a headache.